I'm going to do a little series on manufacturing, because after doing my last post I got a little sucked into the various data sources that are available. Today's installment comes with a special attention conservation notice, however: this post will be extremely boring. I'll get back to my substantive arguments about manufacturing in future posts, and put up some details about trends in productivity in specific sectors, some data that contextualizes the U.S. internationally, and a specific comparison with China. But first, I need to make a detour into definitions and methods, just so that I have it for my own reference. What follows is an attempt to answer a question I've often wanted answered but never seen written up in one place: what, exactly, do published measures of real economic growth actually mean?
The two key concepts in my previous post are manufacturing employment and manufacturing output. The first concept is pretty simple--the main difficulty is to define what counts as a manufacturing job, but there are fairly well-accepted definitions that researchers use. In the International Standard Industrial Classification (ISIC), which is used in many cross-national datasets, manufacturing is definied as:
the physical or chemical transformation of materials of components into new products, whether the work is performed by power- driven machines or by hand, whether it is done in a factory or in the worker's home, and whether the products are sold at wholesale or retail. Included are assembly of component parts of manufactured products and recycling of waste materials.
There is some uncertainty about how to classify workers who are only indirectly involved in manufacturing, but in general it's fairly clear which workers are involved in manufacturing according to this criterion.
The concept of "output", however, is much fuzzier. It's not so hard to figure out what the physical outputs of manufacturing are--what's difficult is to compare them, particularly over time. My last post was gesturing at some concept of physical product: the idea was that we produce more things than we did a few decades ago, but that we do so with far fewer people. However, there is no simple way to compare present and past products of the manufacturing process, because the things themselves are qualitatively different. If it took a certain number of person-hours to make a black and white TV in the 1950's, and it takes a certain number of person-hours to make an iPhone in 2011, what does that tell us about manufacturing productivity?
There are multiple sources of data on manufacturing output available. My last post used the Federal Reserve's Industrial Production data. The Fed says that this series "measures the real output of the manufacturing, mining, and electric and gas utilities industries". They further explain that this measure is based on "two main types of source data: (1) output measured in physical units and (2) data on inputs to the production process, from which output is inferred.". Another U.S. government source is the Bureau of Economic Analysis data on value added by industry, which "is equal to an industry’s gross output (sales or receipts and other operating income, commodity taxes, and inventory change) minus its intermediate inputs (consumption of goods and services purchased from other industries or imported)." For international comparisons, the OECD provides a set of numbers based on what they call "indices of industrial production"--which, for the United States, are the same as the Federal Reserve output numbers. And the United Nations presents data for value-added by industry, which covers more countries than the OECD and is supposed to be cross-nationally comparable, but does not quite match up with the BEA numbers.
The first question to ask is: how comparable are all these different measures? Only the Fed/OECD numbers refer to actual physical output; the BEA/UN data appears to be based only on the money value of final output. Here is a comparison of the different measures, for the years in which they are all available (1970-2009). The numbers have all been put on the same scale: percent of the value in the year 2007.

The red line shows the relationship between the BEA value added numbers and the Fed output numbers, while the blue line shows the comparison between the UN value-added data and the Fed output data. The diagonal black line shows where the lines would fall if these two measures were perfectly comparable. While the overall correlation is fairly strong, there are clear discrepancies. In the pre-1990 data, the BEA data shows manufacturing output being much lower than the Fed's data, while the UN series shows somewhat higher levels of output. The other puzzling result is in the very recent data: according to value-added, manufacturing output has remained steady in the last few years, but according to the Fed output measure it has declined dramatically. It's hard to know what to make of this, but it does suggest that the Great Recession has created some issues for the models used to create these data series.
What I would generally say about these findings is that these different data sources are sufficiently comparable to be used interchangeably in making the points I want to make about long-term trends in manufacturing, but they are nevertheless different enough that one shouldn't ascribe unwarranted precision to them. However, the fact that all the data are similar doesn't address the larger question: how can we trust any of these numbers? Specifically, how do government statistical agencies deal with the problem of comparing qualitatively different outputs over time?
Contemporary National Accounts data tracks changes in GDP using something called a "chained Fisher price index". Statistics Canada has a good explanation of the method. There are two different problems that this method attempts to solve. The first is the problem of combining all the different outputs of an economy at a single point in time, and the second is to track changes from one time period to another. In both instances, it is necessary to distinguish between the quantity of goods produced, and the prices of those goods. Over time, the nominal GDP--that is, the total money value of everything the economy produces--will grow for two reasons. There is a "price effect" due to inflation, where the same goods just cost more, and a "volume effect" due to what StatCan summarizes as "the change in quantities, quality and composition of the aggregate" of goods produced.
StatCan describes the goal of GDP growth measures as follows: "the total change in quantities can only be calculated by adding the changes in quantities in the economy." Thus the goal is something approaching a measure of how much physical stuff is being produced. But they go on to say that:
creating such a summation is problematic in that it is not possible to add quantities with physically different units, such as cars and telephones, even two different models of cars. This means that the quantities have to be re evaluated using a common unit. In a currency-based economy, the simplest solution is to express quantities in monetary terms: once evaluated, that is, multiplied by their prices, quantities can be easily aggregated.
This is an important thing to keep in mind about output growth statistics, such as the manufacturing output numbers I just discussed. Ultimately, they are all measuring things in terms of their price. That is, they are not doing what one might intuitively want, which is to compare the actual amount of physical stuff produced at one point with the amount produced at a later point, without reference to money. This latter type of comparison is simply not possible, or at least it is not done by statistical agencies. (As an aside, this is a recognition of one of Marx's basic insights about the capitalist economy: it is only when commodities are exchanged on the market, through the medium of money, that it becomes possible to render qualitatively different objects commensurable with one another.)
In practice, growth in output is measured using two pieces of information. The first is the total amount of a given product that is sold in a given period. Total amount, in this context, does not refer to a physical quantity (it would be preferable to use physical quanitites, but this data is not usually available), but to the total money value of goods sold. The second piece of information is the price of a product at a given time point, which can be compared to the price in a previous period. The "volume effect"--that is, the actual increase in output--is then defined as the change in total amount sold, "deflated" to account for changes in price. So, for example, say there are $1 billion worth of shoes sold in period 1, and $1.5 billion worth of shoes sold in period 2. Meanwhile, the price of a pair of shoes rises from $50 to $60 between periods 1 and two. The "nominal" change in shoe production is 50%--that is, sales have increased from 1 billion to 1.5 billion. But the real change in the volume of shoes sold is defined as:
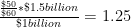
So after correcting for the price increase, the actual increase in the amount of shoes produced is 25 percent. Although the example is a tremendous simplification, it is in essence how growth in output is measured by national statistical agencies.
In order for this method to work, you obviously need good data on changes in price. Governments traditionally get this information with what's called a "matched model" method. Basically, they try to match up two identical goods at two different points in time, and see how their prices change. In principle, this makes sense. In practice, however, there is an obvious problem: what if you can't find a perfect match from one time period to another? After all, old products are constantly disappearing and being replaced by new ones--think of the transition from videotapes to DVDs to Blu-Ray discs, for example. This has always been a concern, but the problem has gotten more attention recently because of the increasing economic importance of computers and information technology, which are subject to rapid qualitative change. For example, it's not really possible to come up with a perfect match between what a desktop computer cost ten years ago and what it costs today, because the quality of computers has improved so much. A $1000 desktop from a decade ago would be blown away by the computing power I currently have in my phone. It's not possible to buy a desktop in 2011 that's as weak as the 2000 model, any more than it was possible to buy a 2011-equivalent PC ten years ago.
Experts in national accounts have spent a long time thinking about this problem. The OECD has a very useful handbook by price-index specialist Jack Triplett, which discusses the issues in detail. He discusses both the traditional matched-model methods and the newer "hedonic pricing" methods for dealing with the situation where an old product is replaced by a qualitatively different new one.
Traditional methods of quality adjustment are based on either measuring or estimating the price of the new product and the old one at a single point in time, and using this as the "quality adjustment". So, for example, if a new computer comes out that costs $1000, and it temporarily exists in the market alongside another model that costs $800, then the new computer is assumed to be 20 percent "better" than the old one, and this adjustment is incorporated into the price adjustment. The intuition here is that the higher price of the new model is not due to inflation, as would be assumed in the basic matched-model framework, but reflects an increase in quality and therefore an increase in real output.
Adapting the previous example, suppose revenues from selling computers rise from $1 billion to $1.5 billion dollars between periods 1 and 2, and assume for simplicity that there is just one computer model, which is replaced by a better model between the two periods. Suppose that, as in the example just given, the new model is priced at $1000 when introduced at time 1, compared to 800 for the old model. Then at time 2, the old model has disappeared, while the new model has risen in price to $1200. As before, nominal growth is 50 percent. With no quality adjustment, the real growth in output is:
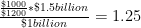
Or 25 percent growth. If we add a quality adjustment reflecting the fact that the new model is 20 percent "better", however, we get:

Meaning that real output has increased by 56 percent, or more than the nominal amount of revenue growth, even adjusting for inflation.
In practice, it's often impossible to measure the prices of old and new models at the same time. There are a number of methods for dealing with this, all of which amount to some kind of imputation of what the relative prices of the two models would have been, had they been observed at the same time. In addition, there are a number of other complexities that can enter into quality adjustments, having to do with changes in package size, options being made standard, etc. For the most part, the details of these aren't important. One special kind of adjustment that is worth noting is the "production cost" adjustment, which is quite old and has been used to measure, for example, model changes in cars. In this method, you survey manufacturers and ask them: what would it have cost you to build your new, higher-quality model in an early period? So for a computer, you would ask: how much would it have cost you to produce a computer as powerful as this year's model, if you had done it last year? However, Triplett notes that in reality, this method tends not to be practical for fast-changing technologies like computers.
Although they are intuitively appealing, it turns out that the traditional methods of quality adjustment have many potential biases. Some of them are related to the difficulty of estimating the "overlapping" price of two different models that never actually overlapped in the market. But even when such overlapping prices are available, there are potential problems: older models may disappear because they did not provide good quality for the price (meaning that the overlapping model strategy overestimates the value of the older model), or the older model may have been temporarily put on sale when the new model was introduced, among other issues.
The problems with traditional quality adjustments gave rise to an alternative method of "hedonic" price indexes. Where the traditional method simply compares a product with an older version of the same product, hedonic indices use a model called a "hedonic function" to predict a product's price based on its characteristics. Triplett gives the example of a study of mainframe computers from the late 1980's, in which a computer's price was modeled as a function of its processor speed, RAM, and other technical characteristics.
The obvious advantage of the hedonic model is that it allows you to say precisely what it is about a new product that makes it superior to an old one. The hedonic model can either be used as a supplement to traditional method, as a way of dealing with changes in products, or it can entirely replace the old methods based on doing one-to-one price comparisons from one time period two another.
The important thing to understand about all of these quality-adjustment methodologies is what they imply about output numbers: growth in the output of the economy can be due to making more widgets, or to making the same number of widgets but making them better. In practice, of course, both types of growth are occuring at the same time. As this discussion shows, quality adjustments are both unavoidable and highly controversial, and they introduce an unavoidable subjective element into the definition of economic output. This has to be kept in mind when using any time series of output over time, since these numbers will reflect the methdological choices of the agencies that collected the data.
Despite these caveats, however, wading into this swamp of technical debates has convinced me that the existing output and value-added numbers are at least a decent approximation of the actual productivity of the economy, and are therefore suitable for making my larger point about manufacturing: the decline of manufacturing employment is less a consequence of globalization than it is a result of technological improvements and increasing labor productivity.


")
")