Social Science

What is output?

April 6th, 2011  |  Published in Statistical Graphics, Statistics

I'm going to do a little series on manufacturing, because after doing my last post I got a little sucked into the various data sources that are available. Today's installment comes with a special attention conservation notice, however: this post will be extremely boring. I'll get back to my substantive arguments about manufacturing in future posts, and put up some details about trends in productivity in specific sectors, some data that contextualizes the U.S. internationally, and a specific comparison with China. But first, I need to make a detour into definitions and methods, just so that I have it for my own reference. What follows is an attempt to answer a question I've often wanted answered but never seen written up in one place: what, exactly, do published measures of real economic growth actually mean?

The two key concepts in my previous post are manufacturing employment and manufacturing output. The first concept is pretty simple--the main difficulty is to define what counts as a manufacturing job, but there are fairly well-accepted definitions that researchers use. In the International Standard Industrial Classification (ISIC), which is used in many cross-national datasets, manufacturing is definied as:

the physical or chemical transformation of materials of components into new products, whether the work is performed by power- driven machines or by hand, whether it is done in a factory or in the worker's home, and whether the products are sold at wholesale or retail. Included are assembly of component parts of manufactured products and recycling of waste materials.

There is some uncertainty about how to classify workers who are only indirectly involved in manufacturing, but in general it's fairly clear which workers are involved in manufacturing according to this criterion.

The concept of "output", however, is much fuzzier. It's not so hard to figure out what the physical outputs of manufacturing are--what's difficult is to compare them, particularly over time. My last post was gesturing at some concept of physical product: the idea was that we produce more things than we did a few decades ago, but that we do so with far fewer people. However, there is no simple way to compare present and past products of the manufacturing process, because the things themselves are qualitatively different. If it took a certain number of person-hours to make a black and white TV in the 1950's, and it takes a certain number of person-hours to make an iPhone in 2011, what does that tell us about manufacturing productivity?

There are multiple sources of data on manufacturing output available. My last post used the Federal Reserve's Industrial Production data. The Fed says that this series "measures the real output of the manufacturing, mining, and electric and gas utilities industries". They further explain that this measure is based on "two main types of source data: (1) output measured in physical units and (2) data on inputs to the production process, from which output is inferred.". Another U.S. government source is the Bureau of Economic Analysis data on value added by industry, which "is equal to an industry’s gross output (sales or receipts and other operating income, commodity taxes, and inventory change) minus its intermediate inputs (consumption of goods and services purchased from other industries or imported)." For international comparisons, the OECD provides a set of numbers based on what they call "indices of industrial production"--which, for the United States, are the same as the Federal Reserve output numbers. And the United Nations presents data for value-added by industry, which covers more countries than the OECD and is supposed to be cross-nationally comparable, but does not quite match up with the BEA numbers.

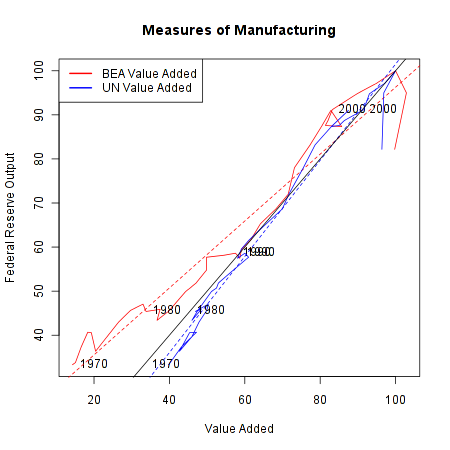
The first question to ask is: how comparable are all these different measures? Only the Fed/OECD numbers refer to actual physical output; the BEA/UN data appears to be based only on the money value of final output. Here is a comparison of the different measures, for the years in which they are all available (1970-2009). The numbers have all been put on the same scale: percent of the value in the year 2007.

Comparison of value added and physical output measures of manufacturing

The red line shows the relationship between the BEA value added numbers and the Fed output numbers, while the blue line shows the comparison between the UN value-added data and the Fed output data. The diagonal black line shows where the lines would fall if these two measures were perfectly comparable. While the overall correlation is fairly strong, there are clear discrepancies. In the pre-1990 data, the BEA data shows manufacturing output being much lower than the Fed's data, while the UN series shows somewhat higher levels of output. The other puzzling result is in the very recent data: according to value-added, manufacturing output has remained steady in the last few years, but according to the Fed output measure it has declined dramatically. It's hard to know what to make of this, but it does suggest that the Great Recession has created some issues for the models used to create these data series.

What I would generally say about these findings is that these different data sources are sufficiently comparable to be used interchangeably in making the points I want to make about long-term trends in manufacturing, but they are nevertheless different enough that one shouldn't ascribe unwarranted precision to them. However, the fact that all the data are similar doesn't address the larger question: how can we trust any of these numbers? Specifically, how do government statistical agencies deal with the problem of comparing qualitatively different outputs over time?

Contemporary National Accounts data tracks changes in GDP using something called a "chained Fisher price index". Statistics Canada has a good explanation of the method. There are two different problems that this method attempts to solve. The first is the problem of combining all the different outputs of an economy at a single point in time, and the second is to track changes from one time period to another. In both instances, it is necessary to distinguish between the quantity of goods produced, and the prices of those goods. Over time, the nominal GDP--that is, the total money value of everything the economy produces--will grow for two reasons. There is a "price effect" due to inflation, where the same goods just cost more, and a "volume effect" due to what StatCan summarizes as "the change in quantities, quality and composition of the aggregate" of goods produced.

StatCan describes the goal of GDP growth measures as follows: "the total change in quantities can only be calculated by adding the changes in quantities in the economy." Thus the goal is something approaching a measure of how much physical stuff is being produced. But they go on to say that:

creating such a summation is problematic in that it is not possible to add quantities with physically different units, such as cars and telephones, even two different models of cars. This means that the quantities have to be re evaluated using a common unit. In a currency-based economy, the simplest solution is to express quantities in monetary terms: once evaluated, that is, multiplied by their prices, quantities can be easily aggregated.

This is an important thing to keep in mind about output growth statistics, such as the manufacturing output numbers I just discussed. Ultimately, they are all measuring things in terms of their price. That is, they are not doing what one might intuitively want, which is to compare the actual amount of physical stuff produced at one point with the amount produced at a later point, without reference to money. This latter type of comparison is simply not possible, or at least it is not done by statistical agencies. (As an aside, this is a recognition of one of Marx's basic insights about the capitalist economy: it is only when commodities are exchanged on the market, through the medium of money, that it becomes possible to render qualitatively different objects commensurable with one another.)

In practice, growth in output is measured using two pieces of information. The first is the total amount of a given product that is sold in a given period. Total amount, in this context, does not refer to a physical quantity (it would be preferable to use physical quanitites, but this data is not usually available), but to the total money value of goods sold. The second piece of information is the price of a product at a given time point, which can be compared to the price in a previous period. The "volume effect"--that is, the actual increase in output--is then defined as the change in total amount sold, "deflated" to account for changes in price. So, for example, say there are $1 billion worth of shoes sold in period 1, and $1.5 billion worth of shoes sold in period 2. Meanwhile, the price of a pair of shoes rises from $50 to $60 between periods 1 and two. The "nominal" change in shoe production is 50%--that is, sales have increased from 1 billion to 1.5 billion. But the real change in the volume of shoes sold is defined as:

\frac{\frac{\$50}{\$60}*\$1.5 billion}{\$1 billion} = 1.25

So after correcting for the price increase, the actual increase in the amount of shoes produced is 25 percent. Although the example is a tremendous simplification, it is in essence how growth in output is measured by national statistical agencies.

In order for this method to work, you obviously need good data on changes in price. Governments traditionally get this information with what's called a "matched model" method. Basically, they try to match up two identical goods at two different points in time, and see how their prices change. In principle, this makes sense. In practice, however, there is an obvious problem: what if you can't find a perfect match from one time period to another? After all, old products are constantly disappearing and being replaced by new ones--think of the transition from videotapes to DVDs to Blu-Ray discs, for example. This has always been a concern, but the problem has gotten more attention recently because of the increasing economic importance of computers and information technology, which are subject to rapid qualitative change. For example, it's not really possible to come up with a perfect match between what a desktop computer cost ten years ago and what it costs today, because the quality of computers has improved so much. A $1000 desktop from a decade ago would be blown away by the computing power I currently have in my phone. It's not possible to buy a desktop in 2011 that's as weak as the 2000 model, any more than it was possible to buy a 2011-equivalent PC ten years ago.

Experts in national accounts have spent a long time thinking about this problem. The OECD has a very useful handbook by price-index specialist Jack Triplett, which discusses the issues in detail. He discusses both the traditional matched-model methods and the newer "hedonic pricing" methods for dealing with the situation where an old product is replaced by a qualitatively different new one.

Traditional methods of quality adjustment are based on either measuring or estimating the price of the new product and the old one at a single point in time, and using this as the "quality adjustment". So, for example, if a new computer comes out that costs $1000, and it temporarily exists in the market alongside another model that costs $800, then the new computer is assumed to be 20 percent "better" than the old one, and this adjustment is incorporated into the price adjustment. The intuition here is that the higher price of the new model is not due to inflation, as would be assumed in the basic matched-model framework, but reflects an increase in quality and therefore an increase in real output.

Adapting the previous example, suppose revenues from selling computers rise from $1 billion to $1.5 billion dollars between periods 1 and 2, and assume for simplicity that there is just one computer model, which is replaced by a better model between the two periods. Suppose that, as in the example just given, the new model is priced at $1000 when introduced at time 1, compared to 800 for the old model. Then at time 2, the old model has disappeared, while the new model has risen in price to $1200. As before, nominal growth is 50 percent. With no quality adjustment, the real growth in output is:

\frac{\frac{\$1000}{\$1200}*\$1.5 billion}{\$1 billion} = 1.25

Or 25 percent growth. If we add a quality adjustment reflecting the fact that the new model is 20 percent "better", however, we get:

\frac{\frac{\$1000}{\$800} * \frac{\$1000}{\$1200} * \$1.5 billion}{\$1 billion} = 1.56

Meaning that real output has increased by 56 percent, or more than the nominal amount of revenue growth, even adjusting for inflation.

In practice, it's often impossible to measure the prices of old and new models at the same time. There are a number of methods for dealing with this, all of which amount to some kind of imputation of what the relative prices of the two models would have been, had they been observed at the same time. In addition, there are a number of other complexities that can enter into quality adjustments, having to do with changes in package size, options being made standard, etc. For the most part, the details of these aren't important. One special kind of adjustment that is worth noting is the "production cost" adjustment, which is quite old and has been used to measure, for example, model changes in cars. In this method, you survey manufacturers and ask them: what would it have cost you to build your new, higher-quality model in an early period? So for a computer, you would ask: how much would it have cost you to produce a computer as powerful as this year's model, if you had done it last year? However, Triplett notes that in reality, this method tends not to be practical for fast-changing technologies like computers.

Although they are intuitively appealing, it turns out that the traditional methods of quality adjustment have many potential biases. Some of them are related to the difficulty of estimating the "overlapping" price of two different models that never actually overlapped in the market. But even when such overlapping prices are available, there are potential problems: older models may disappear because they did not provide good quality for the price (meaning that the overlapping model strategy overestimates the value of the older model), or the older model may have been temporarily put on sale when the new model was introduced, among other issues.

The problems with traditional quality adjustments gave rise to an alternative method of "hedonic" price indexes. Where the traditional method simply compares a product with an older version of the same product, hedonic indices use a model called a "hedonic function" to predict a product's price based on its characteristics. Triplett gives the example of a study of mainframe computers from the late 1980's, in which a computer's price was modeled as a function of its processor speed, RAM, and other technical characteristics.

The obvious advantage of the hedonic model is that it allows you to say precisely what it is about a new product that makes it superior to an old one. The hedonic model can either be used as a supplement to traditional method, as a way of dealing with changes in products, or it can entirely replace the old methods based on doing one-to-one price comparisons from one time period two another.

The important thing to understand about all of these quality-adjustment methodologies is what they imply about output numbers: growth in the output of the economy can be due to making more widgets, or to making the same number of widgets but making them better. In practice, of course, both types of growth are occuring at the same time. As this discussion shows, quality adjustments are both unavoidable and highly controversial, and they introduce an unavoidable subjective element into the definition of economic output. This has to be kept in mind when using any time series of output over time, since these numbers will reflect the methdological choices of the agencies that collected the data.

Despite these caveats, however, wading into this swamp of technical debates has convinced me that the existing output and value-added numbers are at least a decent approximation of the actual productivity of the economy, and are therefore suitable for making my larger point about manufacturing: the decline of manufacturing employment is less a consequence of globalization than it is a result of technological improvements and increasing labor productivity.
The United States Makes Things

April 4th, 2011  |  Published in Political Economy, Social Science, Statistical Graphics, Work

The other day I got involved in an exchange with some political comrades about the state of manufacturing in the United States. We were discussing this Wall Street Journal editorial, which laments that "more Americans work for the government than work in construction, farming, fishing, forestry, manufacturing, mining and utilities combined". Leaving aside the typical right-wing denigration of government work, what should we think about the declining share of of Americans working in industries that "make things"?

I've written about this before. But I'm revisiting the argument in order to post an updated graph and also to present an alternative way of visualizing the data.

Every time I hear a leftist or a liberal declare that we need to create manufacturing jobs or start "making things" again in America, I want to take them by the collar and yell at them. Although there is a widespread belief that most American manufacturing has been off-shored to China and other low-wage producers, this is simply not the case. As I noted in my earlier post, we still make lots of things in this country--more than ever, in fact. We just do it with fewer people. The problem we have is not that we don't employ enough people in manufacturing. The problem is that the immense productivity gains in manufacturing haven't accrued to ordinary people--whose wages have stagnated--but have instead gone to the elite in the form of inflated profits and stock values.

Anyway, I'm revisiting this because I think everyone on the left needs to get the facts about manufacturing employment and output burned into their memory. The numbers on employment in manufacturing are available from the St. Louis Federal Reserve, and the data on output is available from the national Federal Reserve site. Here's an updated version of a graph I've previously posted:

Manufacturing Output and Employment (1)

I like this graph a lot, but today I had another idea for how to visualize these two series. Over at Andrew Gelman's blog, co-blogger Phil posted an interesting graph of bicycing distance and fatalities. That gave me the idea of using the same format for the manufacturing data:

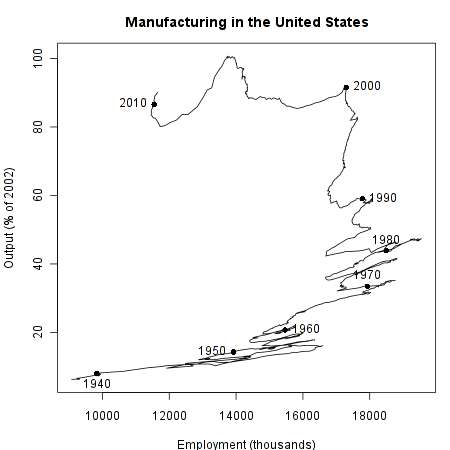
Manufacturing Output and Employment (2)

This graph is interesting because it seems to show three pretty different eras in manufacturing. From the 1940's until around 1970, there was a growth in both employment and output. This, of course, corresponds to the "golden age" of post-war Keynesianism, where the labor movement submitted to capitalist work discipline in return for receiving a share of productivity gains in the form of higher wages. From 1970 until around 2000, output continues to rise rapidly, but employment stays basically the same. Then in the last ten years, employment falls dramatically while output remains about the same.

This big take-home point from all this is that manufacturing is not "in decline", at least in terms of output. Going back to an economy with tons of manufacturing jobs doesn't make any more sense than going back to an economy dominated by agricultural labor--due to increasing productivity, we simply don't need that many jobs in these sectors. Which means that if we are going to somehow find jobs for 20 million unemployed and underemployed Americans, we're not going to do it by building up the manufacturing sector.

Capitalism Without Capitalists

March 23rd, 2011  |  Published in Political Economy, Politics, Socialism, Work

One thing that has long bothered me about many socialist and Marxist critiques of capitalism is that they presume that a system based on the accumulation of *capital* presupposes the existence of *capitalists*--that is, a specific group of people who earn their income from investment, rather than by working for wages. It is totally possible to imagine a system in which profit-making private enterprise still exists, the economy is based on profit-seeking and constant growth, and in which the entire population works as wage-laborers for most of their lives. I always figured the most likely candidate for such an arrangement was some kind of [pension fund socialism](http://www.leftbusinessobserver.com/NSPensions.html). But today, Matt Yglesias gives [another similar path](http://yglesias.thinkprogress.org/2011/03/obtaining-the-returns-to-capital/). He's discussing something from Felix Salmon about how the rich increasingly have access to lots of investment opportunities that are closed off to ordinary investors, and he says:

> [T]he right thing to do is to just directly think about the issue of how best to ensure that everyone obtains the financial benefits of equity investments. And the answer, I think, is sovereign wealth funds. That’s how they do it in Singapore and conceptually it’s the right way to do it. An American version of Singapore’s Central Provident Fund would be much too large for any market to absorb, but the US share of world GDP should shrink over time and it’s conceivable that there would be some way to work this out on the state level to create smaller units. A fund like that would render the public listing issue irrelevant, since it would clearly have the scale to get in on the private equity game. This would, needless to say, entail injecting a hefty element of socialism into American public policy but I’m always hearing from smart conservatives how much they admire Singapore.

This points in the direction of an ideal type of society in which all businesses are owned by sovereign wealth funds of this type, which are used to pay for public services. So everyone works at a job for a wage or salary, and contributes some of their paycheck to one of these funds, just as they now contribute to pension funds. The returns from the funds are then used to pay for things like retirement, health care, education, and so on. Yglesias jokingly refers to this as "socialism". And by certain classic definitions, it is: the capitalist class has been abolished, and the workers now own the means of production (through their sovereign wealth funds).

But in many other ways, of course, this is not how socialism was traditionally conceived. In particular, you would still have profit-seeking companies competing with each other, and they would still be subject to the same kind of discipline they are now--the shareholders, which is to say the sovereign wealth funds, would demand the highest possible return on their investment. So at best, this is a kind of [market socialism](http://books.google.com/books?id=KWy9JbWvjywC). But while there are people who take on the task of the capitalist--the employees of the sovereign wealth funds--they don't make up a *capitalist class*, because they aren't investing for their own personal profit. Indeed, we've already moved a long way in this direction, which is why Peter Drucker was [talking about pension fund socialism](http://tpmcafe.talkingpointsmemo.com/2010/07/23/socialism--american_style/) in 1972.

Of course, we do still have actual capitalists, and getting rid of them would be a long and difficult process. But the important point about capitalism without capitalists is that in many ways it isn't any better than capitalism *with* capitalists. You still have to sell your labor power and submit to a boss in order to survive, so alienation persists. Since firms are still competing to deliver the highest returns to their shareholders, there will still be pressure to exploit employees more intensely and to prevent them from organizing for their rights. Exploitation goes on as before, and it will be all the more robust insofar as it is now a kind of collective self-exploitation. And on top of all of this, the system will still be prone to the booms and busts and problems of overaccumulation that occur in today's capitalism. It was, after all, public and union pension funds that [bought many of the toxic mortgage-backed securities](http://www.bloomberg.com/apps/news?pid=newsarchive&sid=aW5vEJn3LpVw) during the housing bubble.

All of this is why it is analytically important to separate the conceptual framework of *capital and wage labor* from the concept of *capitalists and workers*. In the system I've just described, capital and wage labor still exist, and still define how the economy works. But now each person is simultaneously a capitalist and a worker, in some degree or for some part of their life. Thinking through the inadequacy of such an arrangement is, for me, a more accessible way of thinking through the arguments of people like [André Gorz](http://books.google.com/books?id=7wxpl7sYYCYC) and [Moishe Postone](http://books.google.com/books?id=GwDxsHOxd84C). They argued that the point isn't to get rid of the capitalist class and have the workers take over: the point is to get rid of capital and wage labor.

Translating English into English

January 4th, 2011  |  Published in Art and Literature, Sociology

So it seems there's going to be a [censored version](http://www.publishersweekly.com/pw/by-topic/industry-news/publisher-news/article/45645-upcoming-newsouth-huck-finn-eliminates-the-n-word.html) of *The Adventures of Huckleberry Finn* that replaces the word "nigger" with "slave". My initial reaction was to agree with [Doug Mataconis](http://www.outsidethebeltway.com/publisher-to-delete-racially-insensitive-words-from-huckleberry-finn-tom-sawyer/) that this is both offensive and stupid. It struck me as being of a piece with the general tendency of white Americans to deal with the existence of racism by ignoring it rather than talking about it.

And I guess I still feel that way, but after reading [Kevin Drum's take](http://motherjones.com/kevin-drum/2011/01/bowdlerizing-huck) I'm more sympathetic to Alan Gribben, the Twain scholar responsible for the new censored version. Gribben says that because of the extreme visceral reactions people have to the word "nigger", most teachers today feel they can't get away with assigning *Huck Finn* to their students, even if they'd really like to. So the choice was to either consent to this bowdlerization or else let the book gradually disappear from our culture altogether. I'm still a bit torn about it--and I think that the predicament of the teachers Gribben talked to *is* indicative of precisely the cowardly attitudes toward race that I described above. But I'm willing to accept that censoring the book was the least-bad response to this unfortunate state of affairs.

However, what most caught my attention about Kevin Drum's post on the controversy was this:

> In fact, given the difference in the level of offensiveness of the word *nigger* in 2010 vs. 1884, it's entirely possible that in 2010 the bowdlerized version more closely resembles the intended emotional impact of the book than the original version does. Twain may have meant to shock, but I don't think he ever intended for the word to completely swamp the reader's emotional reaction to the book. Today, though, that's exactly what it does.

That got me thinking a more general thought I've often had about our relationship to old writings: it's a shame that we neglect to re-translate older works into English merely because they were originally written in English. Languages change, and our reactions to words and formulations change. This is obvious when you read something like [Chaucer](http://www.librarius.com/cantales.htm), but it's true to a more subtle degree of more recent writings. There is a pretty good chance that something written in the 19th century won't mean the same thing to us that it meant to its contemporary readers. Thus it would make sense to re-translate *Huckleberry Finn* into modern language, in the same way we periodically get new translations of Homer or Dante or Thomas Mann. This is a point that applies equally well to non-fiction and social theory: in some ways, English-speaking sociologists are lucky that our canonical trio of classical theorists--Marx, Weber, and Durkheim--all wrote in another language. The [most recent translation](http://www.amazon.com/Capital-Critique-Political-Economy-Classics/dp/0140445684) of *Capital* is eminently more readable than the [older ones](http://books.google.com/books?id=fmTUJewBeToC&dq=marx%20capital&pg=PA363#v=onepage&q&f=false)--and I know I could have used a modern English translation of Talcott Parsons when I was studying contemporary theory.

Now, one might respond to this by saying that writing loses much in translation, and that some things just aren't the same unless you read them in the original un-translated form. And that's probably true. But it would still be good to establish the "English-to-English translation" as a legitimate category, since it would give us a better way of understanding things like the new altered version of *Huck Finn*. You would have the original Huck and the "new English translation" of Huck existing side by side; students would read the translation in high school, but perhaps they would be introduced to the original in college. We could debate whether a new translation was good or bad without getting into fruitless arguments over whether one should ever alter a classic book. And maybe it would help us all develop a more historical and contextual understanding of language and be less susceptible to [the arbitrary domination of prescriptive grammarians](http://www.peterfrase.com/2009/09/never-been-in-a-language-riot/).

Obligatory Google Ngram Post

December 20th, 2010  |  Published in Data, Social Science, Statistical Graphics, Time

It appears that everyone with a presence on the Internet is obligated to post some kind of riff on the [amazing Google Ngram Viewer](http://ngrams.googlelabs.com/info). Via Henry Farrell, I see that Daniel Little has attempted to [perpetrate some social science](http://understandingsociety.blogspot.com/2010/12/new-tool-for-intellectual-history.html), which made me think that perhaps while I'm at it, I can post something that actually relates to my dissertation research for a change. Hence, this:

Instances of the phrases "shorter hours" and "higher wages" in the Google ngram viewer.

Click for a bigger version, but the gist is that the red line indicates the phrase "higher wages", and the blue line is "shorter hours". Higher wages have a head start, with hours not really appearing on the agenda until the late 19th century. That's a bit later than I expected, but it's generally consistent with what I know about hours-related labor struggle in the 19th century.

The 20th century is the more interesting part of the graph in any case. For a while, it seems that discussion of wages and hours moves together. They rise in the period of ferment after World War I, and again during the depression. Both decline during World War II, which is unsurprising--both wage and hour demands were subordinated to the mobilization for war. But then after the war, the spike in mentions of "higher wages" greatly outpaces mentions of "shorter hours"--the latter has only a small spike, and thereafter the phrase enters a secular decline right through to the present.

Interest in higher wages appears to experience a modest revival in the 1970's, corresponding to the beginnings of the era of wage stagnation that we are still living in. But for the first time, there is no corresponding increase in discussion of shorter hours. This is again not really surprising, since the disappearance of work-time reduction from labor's agenda as been widely remarked upon. But it's still pretty interesting to see such evidence of it in the written corpus.

Marx’s Theory of Alien Nation

December 10th, 2010  |  Published in Art and Literature, Social Science, Socialism

Charles Stross hits another one out of the park today. The post attempts to explain the widespread sentiment that the masses are politically powerless: "Voting doesn't change anything — the politicians always win." Stross advances the thesis that we have been disempowered by the rise of the corporation: first legally, when corporations were recognized as persons, and then politically, when said corporations captured the democratic process through overt and subtle forms of corruption and bribery.

Playing off the notion of corporations as "persons", Stross portrays the corporation as a "hive organism" which does not share human priorities; corporations are "non-human entities with non-human goals", which can "co-opt" CEOs or politicians by rewarding them financially. The punchline to the argument is that:

In short, we are living in the aftermath of an alien invasion.

I like this argument a lot, but it seems to me that it's less an argument about the corporation as such than an argument about capitalism. Indeed, Marx spoke about capitalism in remarkably similar terms. He notes that the underlying dynamic of capitalism is M-C-M': the use of money to produce and circulate commodities solely for the purpose of accumulating more capital. Money itself is the agent here, not any person. This abstract relationship is more fundamental than the the relations between actual people--capitalists and workers--whose actions are dictated by the exigencies of capital accumulation. From Capital, chapter four:

The circulation of money as capital is, on the contrary, an end in itself, for the expansion of value takes place only within this constantly renewed movement. The circulation of capital has therefore no limits.

As the conscious representative of this movement, the possessor of money becomes a capitalist. His person, or rather his pocket, is the point from which the money starts and to which it returns. The expansion of value, which is the objective basis or main-spring of the circulation M-C-M, becomes his subjective aim, and it is only in so far as the appropriation of ever more and more wealth in the abstract becomes the sole motive of his operations, that he functions as a capitalist, that is, as capital personified and endowed with consciousness and a will.

According to Marx, the alien invasion hasn't just co-opted its human agents but actually corrupted and colonized their minds, so that they come to see the needs of capital as their own needs. Thus the workers find themselvs exploited and alienated, not fundamentally by capitalists but by the alien force, capital, which uses the workers only to reproduce itself. From chapter 23:

The labourer therefore constantly produces material, objective wealth, but in the form of capital, of an alien power that dominates and exploits him; and the capitalist as constantly produces labour-power, but in the form of a subjective source of wealth, separated from the objects in and by which it can alone be realised; in short he produces the labourer, but as a wage labourer. This incessant reproduction, this perpetuation of the labourer, is the sine quâ non of capitalist production.

This, incidentally, is why Maoists like The Matrix.

Moishe Postone makes much of this line of argument in his brilliant Time, Labor, and Social Domination. He emphasizes (p. 30) the point that:

In Marx's analysis, social domination in capitalism does not, on its most fundamental level, consist in the domination of people by other people, but in the domination of people by abstract social structures that people themselves constitute.

Therefore,

the form of social domination that characterizes capitalism is not ultimately a function of private property, of the ownership by the capitalists of the surplus product and the means of production; rather, it is grounded in the value form of wealth itself, a form of social wealth that confronts living labor (the workers) as a structurally alien and dominant power.

Since the "aliens" are of our own making, the proper science fiction allegory isn't an extraterrestrial invasion but a robot takeover, like the Matrix or Terminator movies. But close enough.

So in light of my last post, does this make Capital an early work of science fiction? Or does it make contemporary science fiction the leading edge of Marxism? Both, I'd like to think.

Social Science Fiction

December 8th, 2010  |  Published in Art and Literature, Social Science

Henry Farrell has a nice discussion of some recent debates about steampunk novels. He refers to Charles Stross's complaint that much steampunk is so infatuated with gadgets and elites that it willfully turns away from the misery and exploitation that characterized real Victorian capitalism. He also approvingly notes Cosma Shalizi's argument that "The Singularity has happened; we call it 'the industrial revolution'". Farrell builds on this point by noting that "one of the skeins one can trace back through modern [science fiction] is a vein of sociological rather than scientific speculation, in which events happening to individual characters serve as a means to capture arguments about what is happening to society as a whole". The interesting thing about the 19th century, then, is that it is a period of rapid social transformation, and SF is an attempt to understand the implications of such rapid change. In a similar vein, Patrick Neilsen Hayden quotes Nietzsche: "The press, the machine, the railway, the telegraph are premises whose thousand-year conclusion no one has yet dared to draw."

This relates to some of my own long-gestating speculations about the relationship between science fiction and social science. My argument is that both fields can be understood as projects that attempt to understand empirical facts and lived experience as something which is shaped by abstract--and not directly perceptible--structural forces. But whereas social science attempts to derive generalities about society from concrete observations, SF derives possible concrete events from the premise of certain sociological generalities. Note that this definition makes no reference to the future or the past: science fiction can be about the past, like steampunk, but it is the working out of an alternative past, which branches off from our own timeline according to clearly differences in social structure and technology. If social science is concerned with constructing a model (whether quantitative or qualitative) on the basis of data, then we can think of a science-fictional world by analogy to a prediction from an existing model, such as a fitted statistical model: any particular point prediction reflects both the invariant properties of the model's parameters and the uncertainty and random variation that makes individual cases idiosyncratic.

The following are a few semi-related musings on this theme.

I. The Philosophy of Posterity

One kind of sociologically-driven science fiction is the working out of what I will call a theory of posterity. Posterity, here, is meant to imply the reverse of history. And a theory of posterity, in turn, is an inversion of the logic of a theory of history, or of the logic of social science more generally.

History is a speculative enterprise in which the goal is to construct an abstract conception of society, derived from its concrete manifestations. That is, given recorded history, the historian attempts to discern the large, invisible social forces that generated these events. It is a process of constructing a story about the past, or as Benjamin puts it:

To articulate what is past does not mean to recognize “how it really was.” It means to take control of a memory....

Or consider Benjamin's famous image of the "angel of history":

His face is turned towards the past. Where we see the appearance of a chain of events, he sees one single catastrophe, which unceasingly piles rubble on top of rubble and hurls it before his feet. He would like to pause for a moment so fair [verweilen: a reference to Goethe’s Faust], to awaken the dead and to piece together what has been smashed. But a storm is blowing from Paradise, it has caught itself up in his wings and is so strong that the Angel can no longer close them. The storm drives him irresistibly into the future, to which his back is turned, while the rubble-heap before him grows sky-high.

One way to read this is that the pile of rubble is the concrete accumulation  of historical events, while the storm represents the social forces--especially capitalism, in Benjamin's reading--which drive the logic of events.

But consider what lies behind the angel of history: the future. We cannot know what, concretely, will happen in the future. But we know about the social forces--the storm--which are pushing us inexorably into that future. Herein lies the distinction between the study of history and the study of posterity: a theory of posterity is an attempt to turn the angel of history around, and to tell us what it sees.

Where the historian takes empirical data and historical events and uses them to build up a theory of social structure, a theory of posterity begins with existing social forces and structures, and derives possible concrete futures from them. The social scientist must pick through the collection of empirical details--whether in the form of archives, ethnographic narratives, or census datasets--and decide which are relevant to constructing a general theory, and which are merely accidental and contingent features of the record. Likewise, constructing an understanding of the future requires sorting through all the ideas and broad trends and institutions that exist today, in order to determine which will have important implications for later events, and which will be transient and inconsequential.

Because it must construct the particular out of the general, the study of posterity is most effectively manifested in fiction, which excels in the portrayal of concrete detail, whereas the study of the past takes the form of social science, which is built to represent abstractions. Fictional futures are always preferable to those works of "futurism" which attempt to directly predict the future, obscuring the inherent uncertainty and contingency of that future, and thereby stultifying the reader. Science fiction is to futurism what social theory is to conspiracy theory: an altogether richer, more honest, and more humble enterprise. Or to put it another way, it is always more interesting to read an account that derives the general from the particular (social theory) or the particular from the general (science fiction), rather than attempting to go from the general to the general (futurism) or the particular to the particular (conspiracism).

Science fiction can be understood as a way of writing that adopts a certain general theory of posterity, one which gives a prominent role to science and technology, and then describes specific events that would be consistent with that theory. But that generalization conceals a great diversity of different understandings. And so to understand a work of speculative fiction, therefore, it helps to understand the author's theory of posterity.

II. Charles Stross: the Sigmoid Curve and Punctuated Equilibrium

The work of Charles Stross provides an illuminating case study. Much of his work deals with the near-future, and thus is centrally concerned with extrapolating current social trends in various directions. His most acclaimed novel, Accelerando, is an account of "the singularity": the moment when rapidly accelerating technological progress gives rise to incomprehensibly post-human intelligences.

Like most science fiction, Stross's theory of posterity begins from the interaction of social structure and technology. This is rather too simple a formulation, however, as it tends to imply a sort of technological determinism, where technical developments are considered to be a process that goes on outside of society, and affects it as an external force. Closer to the spirit of Stross--and most good SF--is the following from Marx:

Technology discloses man’s mode of dealing with Nature, the process of production by which he sustains his life, and thereby also lays bare the mode of formation of his social relations, and of the mental conceptions that flow from them.

This formulation, to which David Harvey is quite partial, reveals that technology is not an independent "thing" but rather an intersection of multiple human relationships--the interchange with nature, the process of production (and, we might add, reproduction), and culture.

Stross's theory of posterity places technology at the nexus of capital accumulation, consumer culture, and the state, in its function as the guarantor of contract and property rights. Thus in Accelerando, and also in books like Halting State, financial engineering, video games, hackers, intellectual property, and surveillance interact, and all of them push technology forward in particular directions. This is the mechanism by which Stross arrives at his ironic dystopia in which post-human intelligence takes the form of "sentient financial instruments" and "alien business models".

In surveying this vision, a question arises about the way technological development is portrayed in any theory of posterity. It has been a common trope in science fiction to simply take present-day trends and extrapolate them indefinitely into the future, without regard for any major change in the direction of development. Stross himself has observed this tendency: in the first half of the 20th century, the most rapid technological advances came in the area of transportation. People projected this into the future, and consequently science fiction of that era tended to produce things like flying cars, interstellar space travel, etc.

The implicit model of progress that gave rise to these visions was one in which technology develops according to an exponential curve:

expcurve

The exponential model of development also underpins many popular conceptions of the technological singularity, such as that of Ray Kurzweil. As we reach the rapidly upward-sloping part of the curve, the thinking goes, technological and social change becomes so rapid as to be unpredictable and unimaginable.

But Stross observes that the exponential model probably misconstrues what technical change really looks like. In the case of transportation, he notes that the historical pattern fits a different kind of function:

We can plot this increase in travel speed on a graph — better still, plot the increase in maximum possible speed — and it looks quite pretty; it's a classic sigmoid curve, initially rising slowly, then with the rate of change peaking between 1920 and 1950, before tapering off again after 1970. Today, the fastest vehicle ever built, NASA's New Horizons spacecraft, en route to Pluto, is moving at approximately 21 kilometres per second — only twice as fast as an Apollo spacecraft from the late-1960s. Forty-five years to double the maximum velocity; back in the 1930s it was happening in less than a decade.

Below is the sigmoid curve:

sigcurve

It might seem as though Accelerando, at least, isn't consistent with this model, since it looks more like a Kurzweil-style exponential singularity. But another way of looking at it is that the sigmoid curve simply plays out over a very long time scale: the middle parts of the book portray incredibly rapid changes, but by the end of the book the characters once again seem to be living in a world of fairly sedate development. This environment is investigated further in the followup Glasshouse, which pushes the singularity story perhaps as far as it will  go--to the point where it begins to lose all contact with the present, rendering further extrapolation impossible.

What's most interesting about the sigmoid-curve interpretation of technology, however, is what it implies about the interaction between different technological sectors over the course of history. Rather than ever-accelerating progress, the history of technology now looks to be characterized by something like what paleontologists call Punctuated Equilibrium: long periods of relative stasis, interspersed with brief spasms of rapid evolution. If history works this way, then projecting the future becomes far more difficult. The most important elements of the present mix of technologies are not necessarily the most prominent ones; it may be that some currently insignificant area will, in the near future, blow up to become the successor to the revolution in Information Technology.

In a recent speech, Stross futher elaborates on this framework as it relates to present trends in technology. He goes farther than in previous work in rejecting a key premise of the singularity, which is that the exponential growth in raw computing power will continue indefinitely:

I don't want to predict what we end up with in 2020 in terms of raw processing power; I'm chicken, and besides, I'm not a semiconductor designer. But while I'd be surprised if we didn't get an order of magnitude more performance out of our CPUs between now and then — maybe two — and an order of magnitude lower power consumption — I don't expect to see the performance improvements of the 1990s or early 2000s ever again. The steep part of the sigmoid growth curve is already behind us.

However, Stross notes that even as the acceleration in processor powers drops, we are seeing a distinct kind of development based on ubiqitous fast wireless Internet connections and portable computing devices like the iPhone. The consequence of this is to erode the distinction between the network and "real" world:

Welcome to a world where the internet has turned inside-out; instead of being something you visit inside a box with a coloured screen, it's draped all over the landscape around you, invisible until you put on a pair of glasses or pick up your always-on mobile phone. A phone which is to today's iPhone as a modern laptop is to an original Apple II; a device which always knows where you are, where your possessions are, and without which you are — literally — lost and forgetful.

This is, essentially, the world of Manfred Macx in the opening chapters of Accelerando.  It is incipient in the world of Halting State, and its further development will presumably be interrogated in that book's sequel, Rule 34.

III. William Gibson and the Technicians of Culture

William Gibson is another writer who has considered the near future, and his picture in Pattern Recognition and Spook Country maps out a consensus future rather similar to Stross's. In particular, the effacing of the boundary between the Internet and everyday life is ever-present in these books, right down to a particular device--the special glasses which project images onto the wearer's environment--that plays a central role for both writers.

Yet technology for Gibson is embedded in a different social matrix. The state and its bureaucracy are less present than in Stross; indeed, Gibson's work is redolent of 1990's style imaginings of the globalized world, after the withering of the nation-state. Capital, meanwhile, is ever-present, but its leading edge is quite different. Rather than IP cartels or financiers or game designers, the leading force in Gibson's world is the culture industry, and in particular advertizing and marketing.

This is in keeping with Gibson's general affinity for, and deep intuitive understanding of, the world of consumer commodities. Indeed, his books are less about technology than they are meditations on consumer culture and its objects; the loving way in which brands and products are described reveals Gibson's own infatuation with these commodities. Indeed, his instincts are so well tuned that an object at the center of Pattern Recognition turned out to be a premonition of an actual commodity.

This all leads logically to a theory of the future in which changes in society and technology are driven by elements of the culture industry: maverick ad executives, cool-hunters, former indie-rock stars and avant-garde artists all figure in the two recent works. Gibson maintains a conception of the high culture-low culture divide, and the complex interrelation between the two poles, which is lacking in Stross. The creation and re-creation of symbols and meaning is the central form of innovation in his stories.

Insofar as Gibson's recent writing is the working out of a social theory, its point of departure is Fredric Jameson's theorization of postmodern capitalist culture. Jameson observed back in the 1970's that one of the definitive characteristics of late capitalism was that "aesthetic production today has become integrated into commodity production generally". Gibson, like Stross and other science fiction writers, portrays the effects of rapid change in the technologies of production, but in this case it is the technologies of aesthetic production rather than the assembly line, transportation, or communication.

And it does indeed seems that cultural innovation and recombination has accelerated rapidly in the past few decades. But in light of Stross, the question becomes: are we reaching the top of the sigmoid curve? It sometimes seems that we are moving into a world where Capital is more an more concerned with extracting rents from the control of "intellectual property" rather than pushing toward any kind of historically progressive technological or even cultural innovation. But I will save the working out of that particular theory of posterity for another post.

The Abuse of Statistical Significance: A Case Study

April 18th, 2010  |  Published in Social Science, Statistics

For years now--decades, in fact--statisticians and social scientists have been complaining about the practice of testing for the presence of some relationship in data by running a regression and then looking to see whether some coefficient is statistically significant at some arbitrary confidence level (say, 95 percent.) And while I completely endorse these complaints, they can often seem rather abstract. Sure, you might say, the significance level is arbitrary, and you can always find a statistically significant effect with a big enough sample size, and statistical significance isn't the same as substantive importance. But as long as you're sensitive to these limitations, surely it can't hurt to use statistical significance as a quick way of checking whether you need to pay attentio to a relationship between variables, or whether it can be safely ignored?

As it turns out, a reliance on statistical significance can lead you to a conclusion that is not just imprecise or misleading, but is in fact the exact opposite of the correct answer. Until now, I've never found a really simple, clear example of this, although the stuff discussed in Andrew Gelman's "The Difference Between 'Significant' and 'Not Significant' Is Not Statistically Significant" is a good start. But now along comes Phil Birnbaum with a report of a really amazing howler of a bad result, driven entirely by misuse of statistical significance. This is going to become my go-to example of significance testing gone horribly wrong.

Birnbaum links to this article, which used a study of cricket players to argue that luck plays a big role in how people fare in the labor market. The basic argument is that cricket players do better at home than on the road, but that teams don't take this into account when deciding what players to keep for their team. The result is that some players are more likely to be dropped just because they had the bad luck to make their debut on the road.

Now, I happen to be inclined a priori to agree with this argument, at least for labor markets in general if not cricket (which I don't know anything about). And perhaps because the argument is intuitively compelling, the paper was discussed on the New York Times Freakonomics blog and on Matt Yglesias's blog. But the analysis that the authors use to make their case is entirely bogus.

Birnbaum goes into it in excellent detail, but the gist of it is as follows. They estimate a regression of the form:

In this model, Avg is your average as a cricket bowler, and HomeDebut is 1 if you debut at home, 0 if you debut on the road.  We expect coefficient B to be negative--if your average is lower, you have a better chance of being dropped. But if teams are taking the home field advantage into account, coefficients C and D should be positive, indicating that teams will value the same average more if it was achieved on the road rather than at home.

And what did the authors find? C and D were indeed positive. This would suggest that teams do indeed discount high averages that were achieved at home relative to those achieved on the road. Yet the authors write:

[D]ebut location is superfluous to the retention decision. Information about debut location is individually and jointly insignificant, suggesting that these committees focus singularly on debut performance,  regardless of location. This signal bias suggests that batsmen lucky enough to debut at home are more likely to do well on debut and enjoy greater playing opportunities.

How do they reach this conclusion? By noting that the coefficients for the home-debut variables are not statistically significant. But as Birnbaum points out, the magnitudes and directions of the coefficients are completely consistent with what you might expect to find if there was in fact no home-debut bias in retention decisions. And the regressions are only based on 431 observations, meaning that large standard errors are to be expected. So it's true that the confidence intervals on these coefficients include zero--but that's not the same as saying that zero is the most reasonable estimate of their true value! As the saying goes, absence of evidence is not evidence of absence. As Birnbaum says, all these authors have really shown is that they don't have enough data to properly address their question.

Birnbaum goes into all of this in much more detail. I'll just add one additional thing that makes this case especially egregious. All the regressions use "robust standard errors" to correct for heteroskedasticity. Standard error corrections like these are very popular with economists, but this is a perfect example of why I hate them. For what does the robustness-correction consist of? In general, it makes standard errors larger. This is intended to decrease the probability of a type I error, i.e., finding an effect that is not there. But by the same token, larger standard errors increase type II error, failing to find an effect that is there. And in this case, the authors used the failure to find an effect as a vindication of their argument--so rather than making the analysis more conservative -i.e., more robust to random variation and mistaken assumptions--the "robust" standard errors actually tip the scales in favor of the paper's thesis!

It's entirely possible that the authors of this paper were totally unaware of these problems, and genuinely believed their findings because they had so internalized the ideology of significance-testing. And the bloggers who publicized this study were, unfortunately, engaging in a common vice: promoting a paper whose findings they liked, while assuming that the methodology must be sound because it was done by reputable people (in this case, IMF economists.) But things like this are exactly why so many people--both inside and outside the academy--are instinctively distrustful of quantitative research. And the fact that Phil Birnbaum dug this up exemplifies what I love about amateur baseball statisticians, who tend to be much more flexible and open minded in their approach to quantitative methods. I suspect a lot of trained social scientists would have read over this thing without giving it a second though.

Republican Census Protestors: Myth or Reality?

April 1st, 2010  |  Published in Politics, Statistical Graphics, Statistics

April 1 is "Census Day", the day on which you're supposed to have turned in your response to the 2010 census. Of course, lots of people haven't returned their form, and the Census Bureau even has a map where you can see how the response rates look in different parts of the country.

Lately, there's been a lot of talk about the possibility that conservatives are refusing to fill out the census as a form of protest. This behavior has been encouraged by the anti-census rhetoric of elected officials such as Representatives Michelle Bachman (R-MN) and Ron Paul (R-TX).  In March, the Houston Chronicle website reported that response rates in Texas were down, especially in some highly Republican areas. And conservative Republican Patrick McHenry (R-NC) was so concerned about this possible refusal--which could lead conservative areas to lose federal funding and even congressional representatives--that he went on the right-wing site redstate.com to encourage conservatives to fill out the census.

Thus far, though, we've only heard anecdotal evidence that right-wing census refusal is a real phenomenon. Below I try to apply more data to the question.

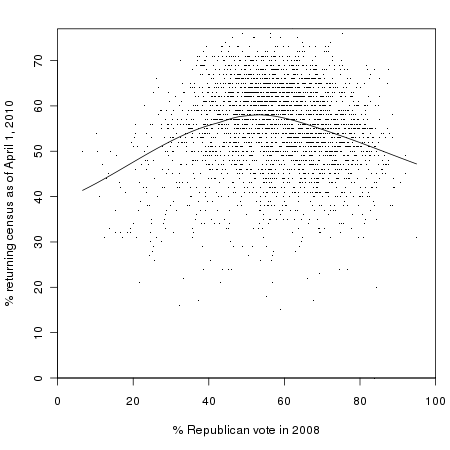
The Census Bureau provides response rates by county in a downloadable file on their website.  The data in this post were downloaded on April 1. To get an idea of how conservative a county is, we can use the results of the 2008 Presidential election, and specifically Republican share of the two-party vote--that is, the percentage of people in a county who voted for John McCain, with third-party votes excluded. The results look like this:

It certainly doesn't look like there's any overall trend toward lower participation in highly Republican counties, and indeed the correlation between these two variables is only -0.01. In fact, the highest participation seems to be in counties that are neither highly Democratic nor highly Republican, as shown by the trend line.

So, myth: busted? Not quite. There are some other factors that we should take into account that might hide a pattern of conservative census resistance. Most importantly, many demographic groups that tend to lean Democratic, such as the poor and non-whites, are also less likely to respond to the census. So even if hostility to government were holding down Republican response rates, they still might not appear to be lower than Democratic response rates overall.

Fortunately, the Census Bureau has a measure of how likely people in a given area are to be non-respondents to the census, which they call the "Hard to Count score". This combines information on multiple demographic factors including income, English proficiency, housing status, education, and other factors that may make people hard to contact. My colleagues Steve Romalewski and Dave Burgoon have designed an excellent mapping tool that shows the distribution of these hard-to-count areas around the county, and produced a report on the early trends in census response around the country.

We can test the conservative census resistance hypothesis using a regression model that predicts 2010 census response in a county using the 2008 McCain vote share, the county Hard to Count score, and the response rate to the 2000 census. Including the 2000 rate will help us further isolate any Republican backlash to the census, since it's a phenomenon that has supposedly arisen only within the last few years. Since different counties can have wildly differing population densities, the data is weighted according to population.* The resulting model explains about 70% of the variation in census response across counties, and the equation for predicting the response looks like this:

The coefficient of 0.06 for the Republican vote share variable means that when we control for the 2000 response rate and the county HTC score, Republican areas actually have higher response rates, although the effect is pretty small.  If two counties have identical HTC scores and 2000 response rates but one of them had a 10% higher McCain vote in 2008, we would expect the more Republican county to have a 0.6% higher census 2010 response rate. **

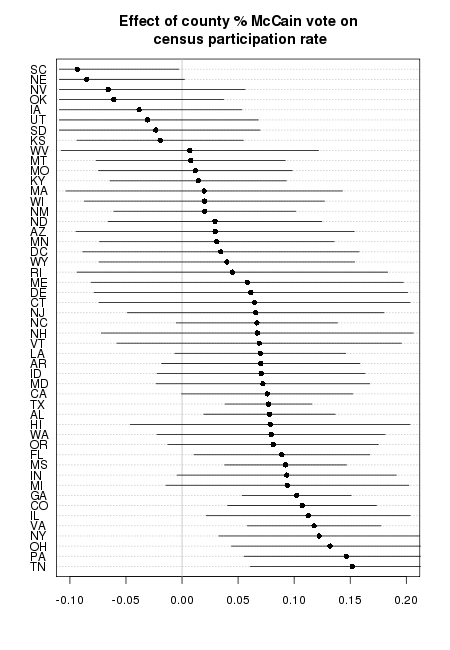
Now, recall that the original news article that started this discussion was about Texas. Maybe Texas is different? We can test that by fitting a multi-level model in which we allow the effect of Republican vote share on census response to vary between states. The result is that rather than a single coefficient for the Republican vote share (the 0.06 in the model above), we get 50 different coefficients:

Or, if you prefer to see your inferences in map form:

The reddish states are places where having more Republicans in a county is associated with a lower response rate to the census, and blue states are places where more Republican counties are associated with higher response rates.

We see that there are a few states where Republicans seem to have lower response rates than Democratic ones, such as South Carolina and Nebraska. Even here, though, the confidence intervals are crossing zero or close to it. And Texas doesn't look particularly special, the more Republican areas there seem to have better response rates (when controlling for the other variables), just like most other places.

So given all that, how can we explain the accounts of low response rates in Republican areas? The original Houston Chronicle news article says that:

In Texas, some of the counties with the lowest census return rates are among the state's most Republican, including Briscoe County in the Panhandle, 8 percent; King County, near Lubbock, 5 percent; Culberson County, near El Paso, 11 percent; and Newton County, in deep East Texas, 18 percent.

OK, so let's look at those counties in particular. Here's a comparison of the response rate to the 2000 census, the response this year, and the response that would be predicted by the model above. (These response rates are higher than the ones quoted in the article, because they are measured at a later date.)

Population Response,

2000

Response,

2010

Predicted

Response

Error Republican

vote, 2008

King County, TX 287 48% 31% 43% 12% 95%
Briscoe County, TX 1598 61% 41% 51% 10% 75%
Culberson County, TX 2525 38% 34%
Newton County, TX 14090 51% 34% 43% 9% 66%

The first thing I notice is that the Chronicle was fudging a bit when it called these "among the state's most Republican" counties. Culberson county doesn't look very Republican at all! The others, however, fit the bill. And for all three, the model does substantially over-predict census response.  (Culberson county has no data for the 2000 response rate, so we can't get a prediction there.) What's going on here? It looks like maybe there's something going on in these counties that our model didn't capture.

To understand what's going on, let's take a look at the ten counties where the model made the biggest over-predictions of census response:

Population Response,

2000

Response,

2010

Predicted

Response

Error Republican

vote, 2008

Duchesne County, UT 15701 41% 0% 39% 39% 84%
Forest County, PA 6506 68% 21% 57% 36% 57%
Alpine County, CA 1180 67% 17% 49% 32% 37%
Catron County, NM 3476 47% 17% 39% 22% 68%
St. Bernard Parish, LA 15514 68% 37% 56% 19% 73%
Sullivan County, PA 6277 63% 35% 53% 18% 60%
Lake of the Woods County, MN 4327 46% 27% 45% 18% 57%
Cape May County, NJ 97724 65% 36% 54% 18% 54%
Edwards County, TX 1935 45% 22% 39% 17% 66%
La Salle County, TX 5969 57% 26% 43% 17% 40%%

I have a hard time believing that the response rate in Duchesne county, Utah is really 0%, so that's probably some kind of error. But as for the rest, most of these counties are heavily Republican too, which suggests that maybe there is some phenomenon going on here that we just aren't capturing. But now look at the counties where the model made the biggest under-prediction--where it thought response rates would be much lower than they actually were:

Population Response,

2000

Response,

2010

Predicted

Response

Error Republican

vote, 2008

Oscoda County, MI 9140 37% 66% 36% -30% 55%
Nye County, NV 42693 13% 47% 22% -25% 57%
Baylor County, TX 3805 51% 66% 45% -21% 78%
Clare County, MI 31307 47% 62% 42% -20% 48%
Edmonson County, KY 12054 55% 65% 46% -19% 68%
Hart County, KY 18547 62% 68% 49% -19% 66%
Dare County, NC 33935 35% 57% 39% -18% 55%
Lewis County, KY 14012 61% 66% 48% -18% 68%
Gilmer County, WV 6965 59% 63% 45% -18% 59%
Crawford County, IN 11137 62% 68% 51% -17% 51%

Most of these are Republican areas too!

So what's going on? It's hard to say, but my best guess is that part of it has to do with the fact that most of these are fairly low-population counties. With a smaller population, these places are going to show more random variability in their average response rates than the really big counties. Smaller counties tend to be rural counties, and rural areas tend to be more conservative. Thus, it's not surprising that the places with the most surprising shortfalls in census response are heavily Republican--and that the places with the most surprising high response rates are heavily Republican too.

At this point, I have to conclude that there really isn't any firm evidence of Republican census resistance. That's not to say it doesn't exist. I'm sure it does, even if it's not on a large enough scale to be noticeable in the statistics.  It's also possible that the Republican voting variable I used isn't precise enough--the sort of people who are most receptive to anti-census arguments are probably a particular slice of far-right Republican. And it's always difficult to make any firm conclusions about the behavior of individuals based on aggregates like county-level averages, without slipping into the ecological fallacy. Nonetheless, these results do suggest the strong possibility that the media have been led astray by a plausible narrative and a few cherry-picked pieces of data.

* Using unweighted models doesn't change the main conclusions, although it does bring some of the Republican vote share coefficients closer to zero--meaning that it's harder to conclude that there is any relationship between Republican voting and census response, either positive or negative.

** All of these coefficients are statistically significant at a 95% confidence level.

Pessimism of the Intellect, revisited

March 22nd, 2010  |  Published in Politics, Statistical Graphics

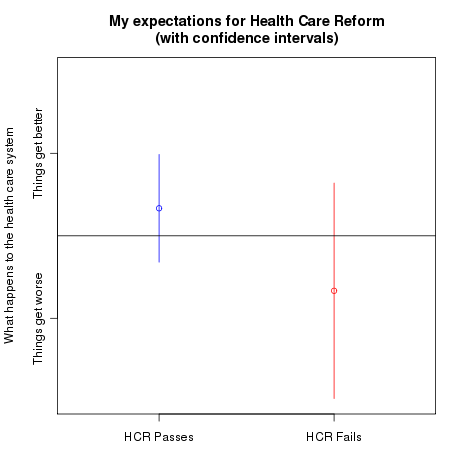
In light of recent events and the ambivalence expressed in the Health Care Reform thread I started at the Activist, it seemed appropriate to resurrect the graphic from this post: